TL;DR. Loggd shows your habits on a GitHub-style contribution grid: every day you log adds color, and a missed day is just a lighter square, not a reset to zero. This fixes the biggest flaw in streak-based trackers, where one missed day wipes your progress and most people quit. The grid rewards overall consistency instead of perfection.
Most habit trackers put a number at the top of the screen and ask you to protect it. Thirty days. Forty. Then life happens, you miss one, and the number drops to zero. For a lot of people that zero is where the habit dies.
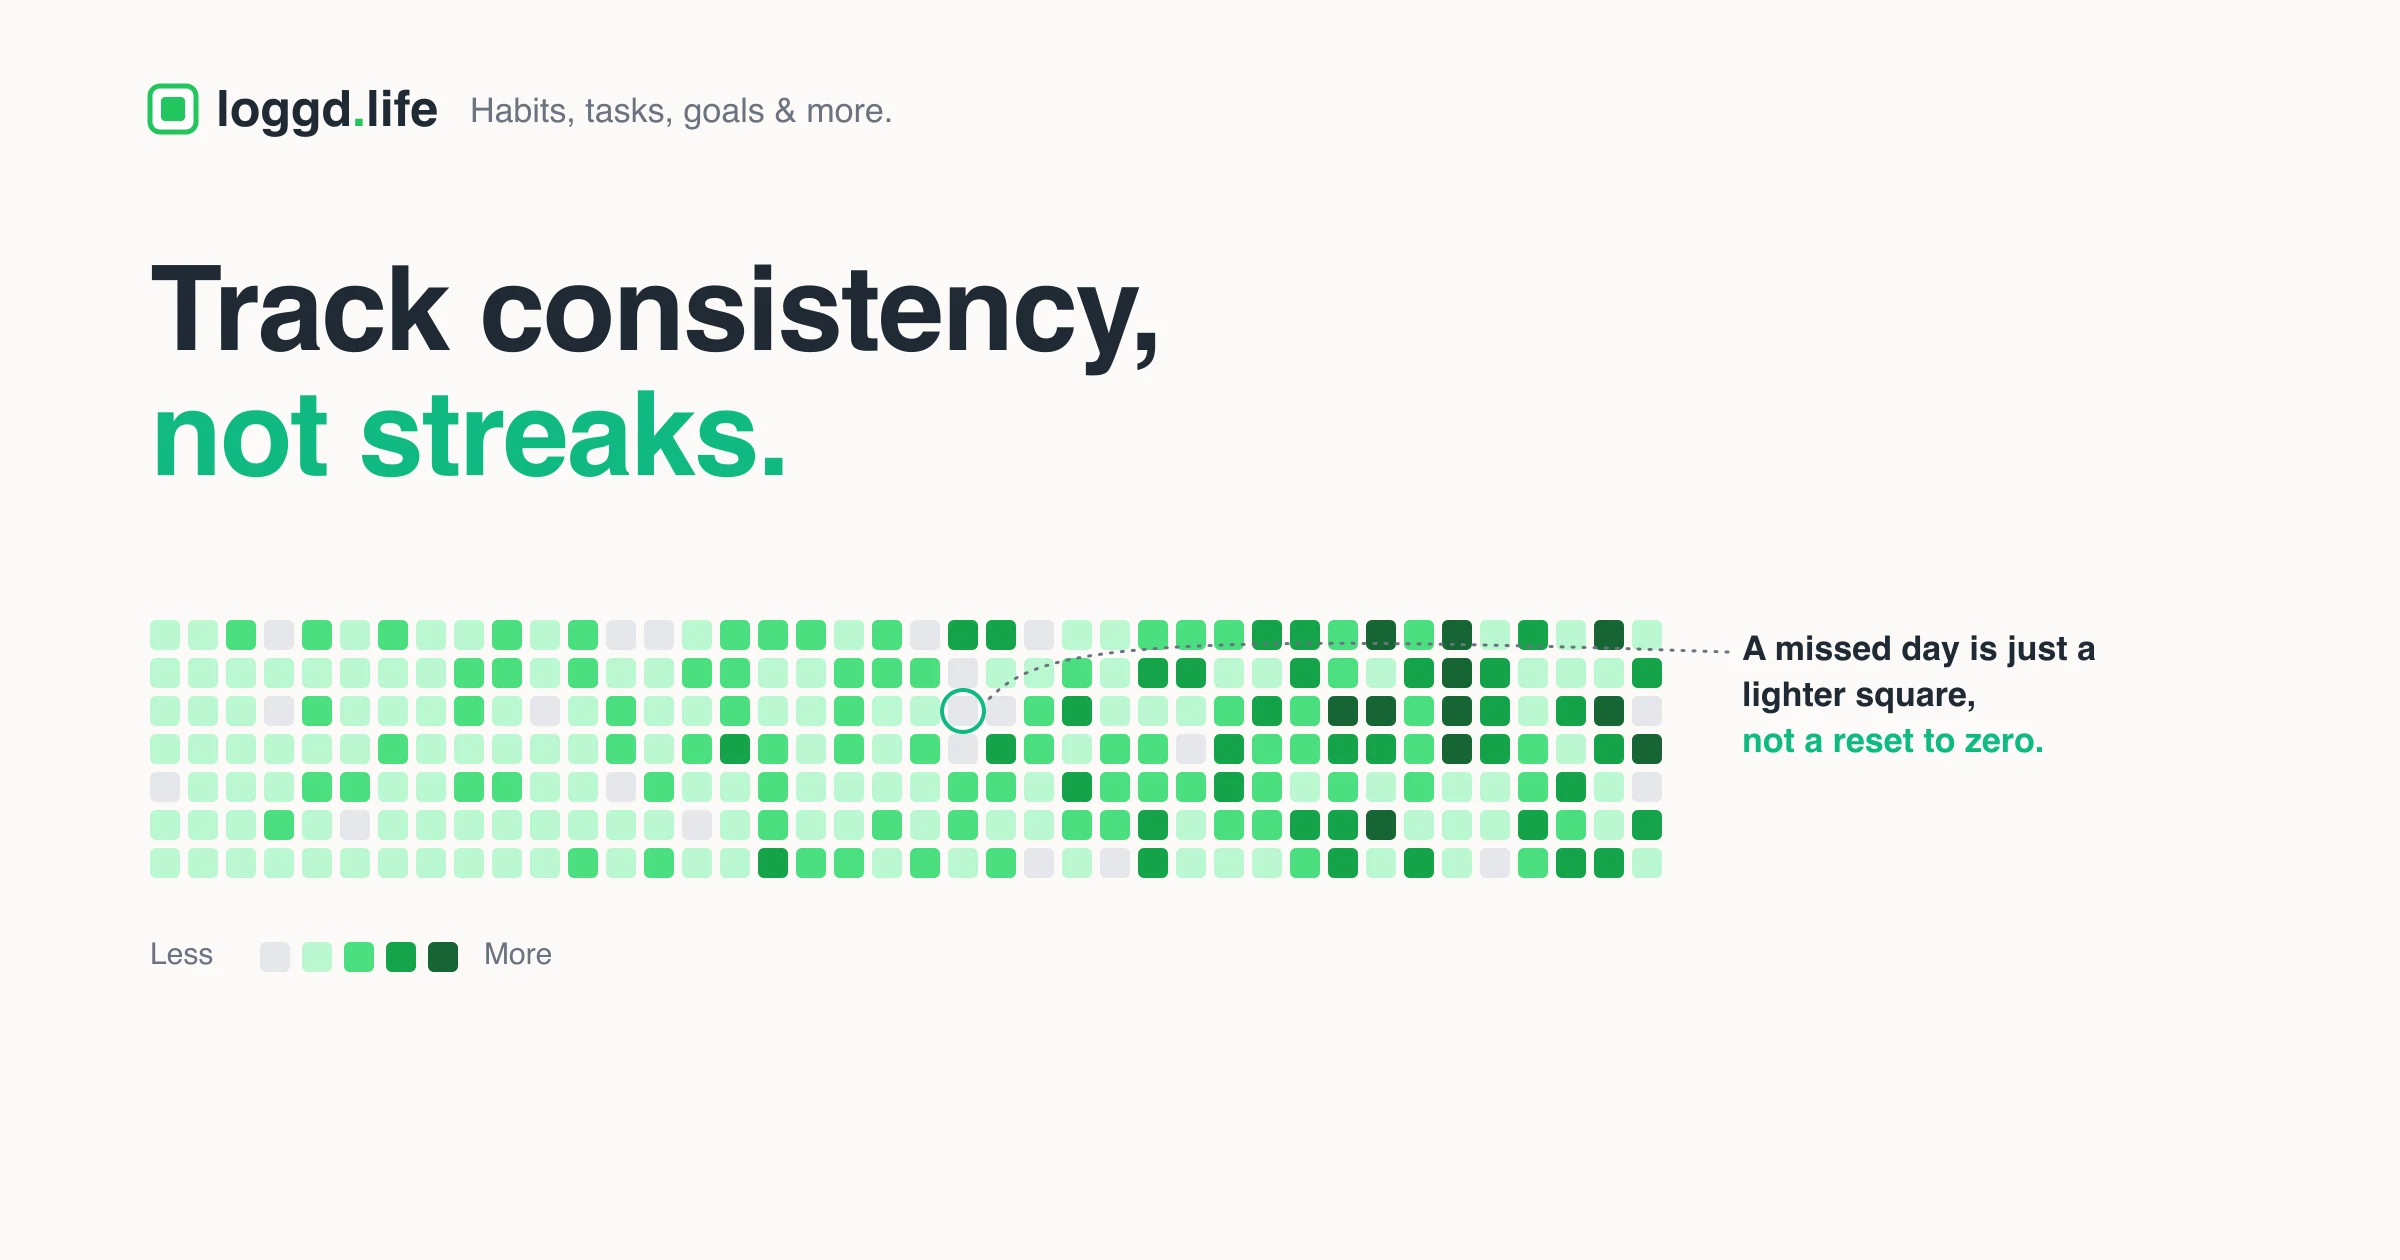
Loggd takes a different approach. Instead of a streak counter as the headline, every habit gets a contribution grid: a year of small squares that get greener the more you log, exactly like the activity graph on a GitHub profile. A missed day does not erase anything. It is one lighter square in a wall of darker ones.
That single design choice changes how it feels to slip. And how it feels to slip is, for most people, the whole game.

What is the contribution grid?
The contribution grid is a heatmap of your habit history. Each square is a day. The more you do on a given day, the darker green the square gets. Loggd shows a rolling 365-day window by default, so a single glance covers your whole year of effort for that habit.
If you have ever looked at a developer's GitHub profile and seen that wall of green squares, you already understand it. Same mental model, applied to whatever you are trying to build.
Here is what a square's shade actually means:
| Shade | What it represents |
|---|---|
| Empty / lightest | Nothing logged that day |
| Light green | Logged once, or a small amount |
| Medium green | More activity, or partway to your daily target |
| Dark green | A strong day for that habit |
| Darkest green | A heavy day (lots of check-ins or long sessions) |
The grid is not just "did something happen". Loggd adjusts the intensity to the kind of habit you are tracking:
- A simple yes/no habit (meditate, take vitamins) shades the day when you complete it.
- A multiple-times-a-day habit (drink water, eight glasses) gets darker as you log more.
- A time-based habit (read, practice guitar) shades by how many minutes you put in, scaled against your own typical sessions.
So a year of meditation and a year of reading both look like contribution grids, but they speak the language of each habit.
Why all-or-nothing streaks make people quit
Streaks come from the "Don't Break the Chain" idea, often attributed to Jerry Seinfeld (the attribution is apocryphal, but the method stuck). Mark an X on the calendar every day you do the thing, and your only job is to not break the chain. It is a clean, motivating idea, and for some people it genuinely works.
The problem is what happens on the day you miss.
A streak has exactly one failure state, and it is total. Twenty-eight days becomes zero. There is no partial credit, no "you were 93% consistent this month". The counter does not care that you nailed almost every day. It only knows the chain broke.
That collides with a well-documented bit of psychology. In relapse research it is called the abstinence-violation effect: once you cross the line you drew for yourself, the line stops protecting you, and "I missed one day" slides into "I might as well stop". Dieters know this as the blown-diet spiral. One cookie becomes the whole packet because the day is already "ruined". Streaks manufacture that exact line, then dare you to cross it.
So the people most likely to quit a streak-based tracker are not the lazy ones. They are the ones who did well for weeks, slipped once, and got told by a number that it all counted for nothing.
A streak punishes the miss far more than it rewards the 28 days you actually showed up. That is backwards.
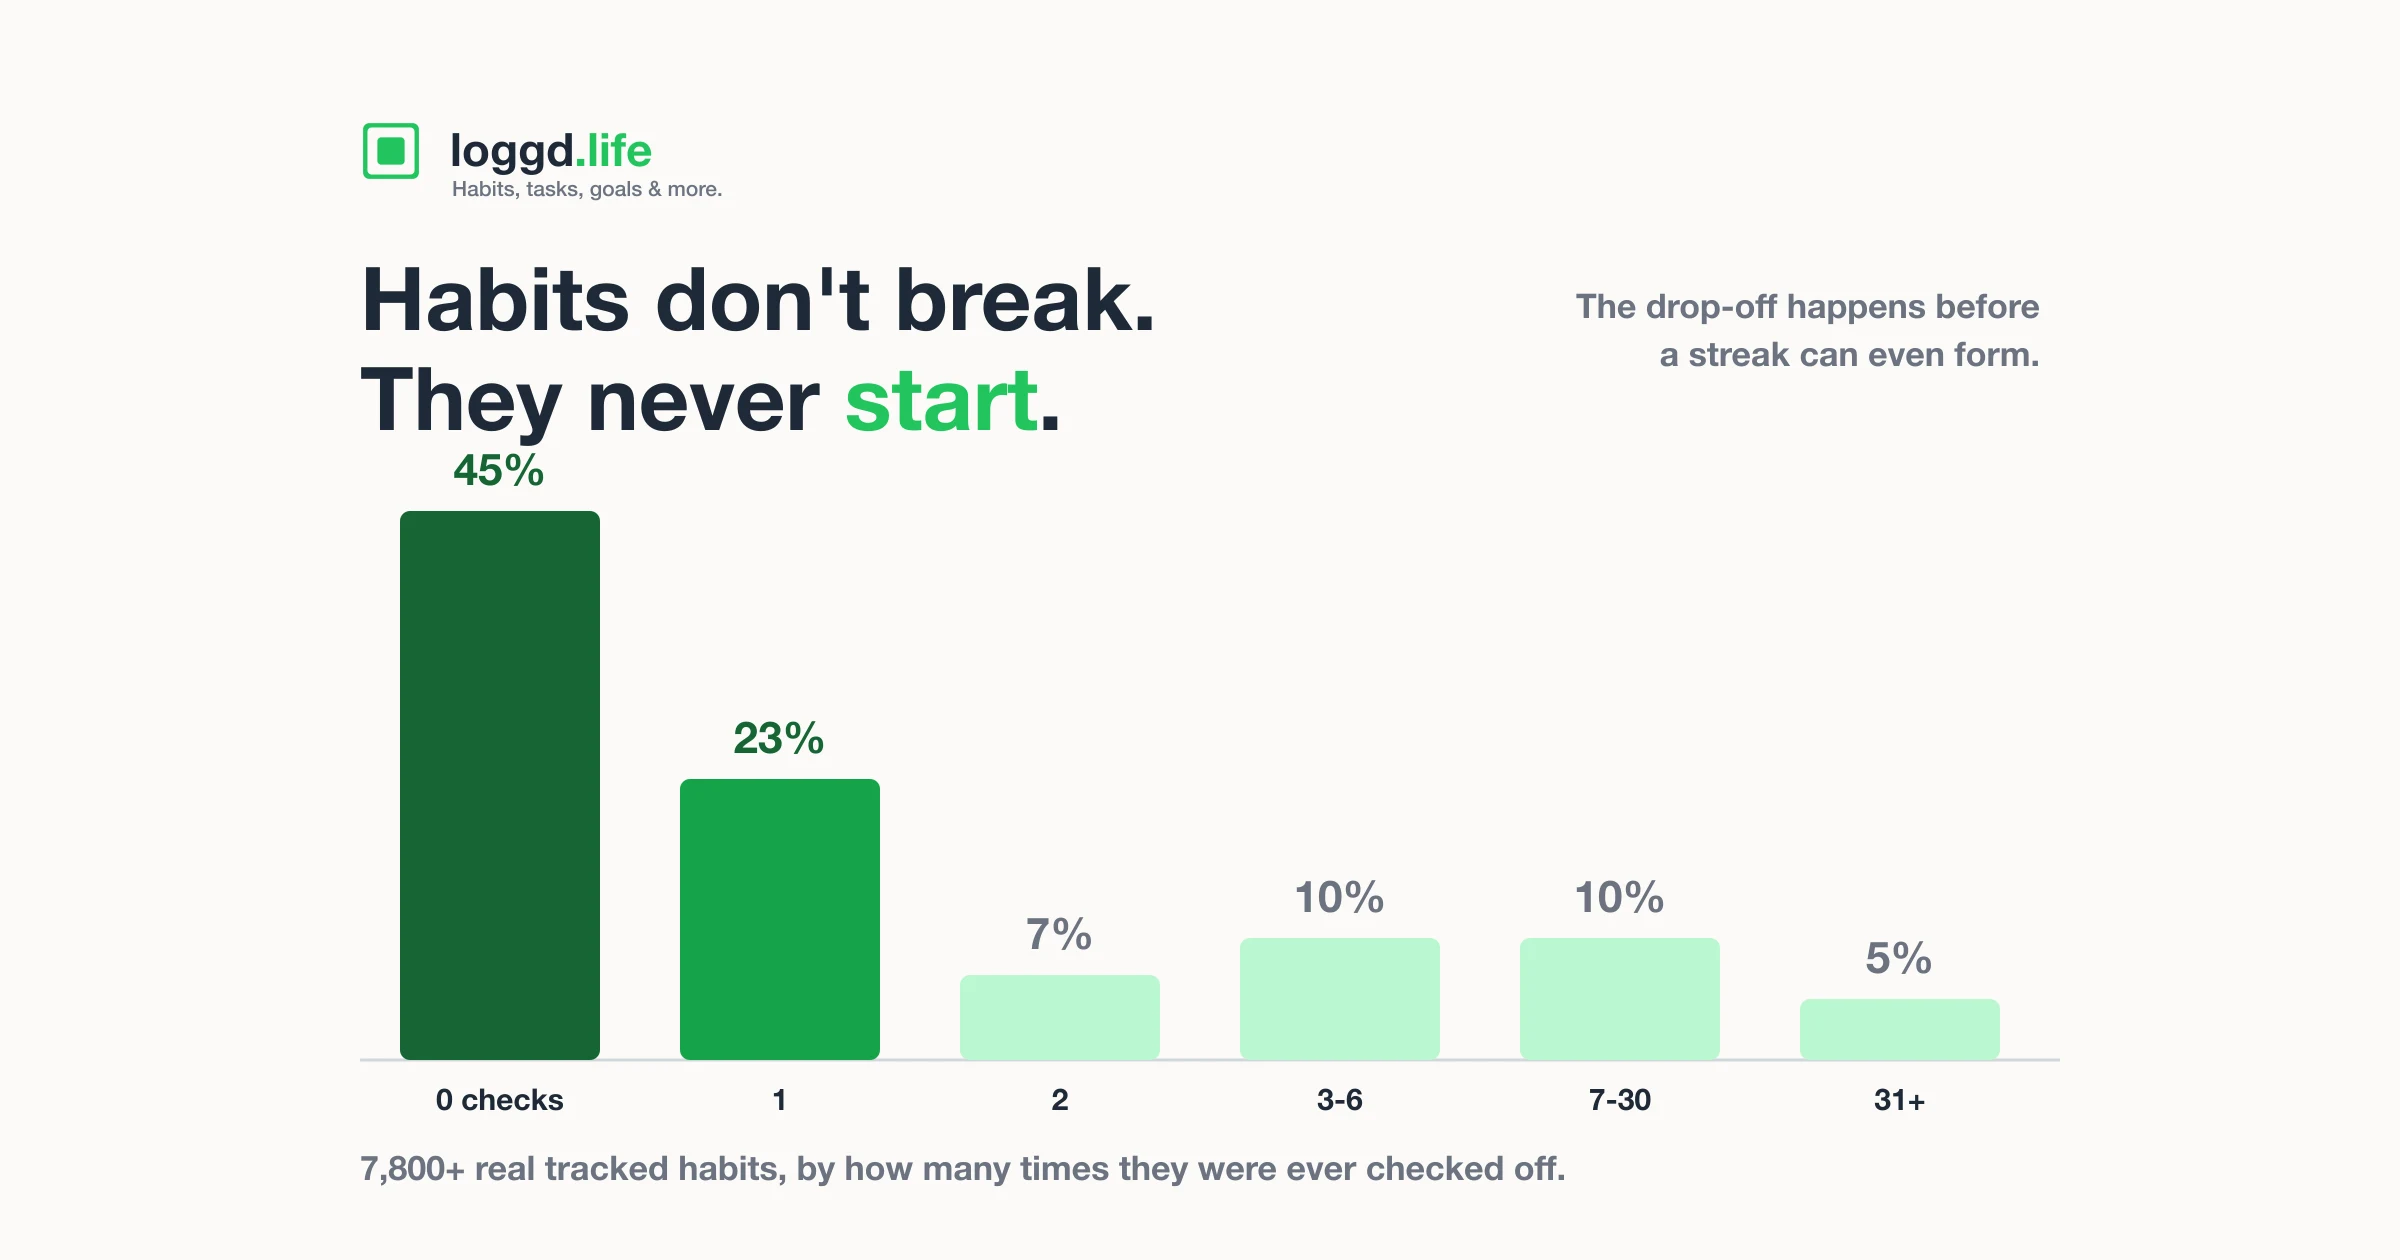
This is not just a hunch. Looking across Loggd's own habit data, the most common outcome for a new habit is that it never gets past a day or two before going quiet. Most habits do not die because someone lacked discipline for months. They die early, often right after the first stumble, which is precisely the moment a streak counter is harshest.
How the grid shows consistency without punishment
The grid removes the single failure state. There is no chain to break, so there is nothing to lose when you miss a day.
Compare the two views side by side after a realistic month, say you logged 26 of 30 days with four scattered misses:
| Streak counter | Contribution grid | |
|---|---|---|
| After 26 of 30 days | Shows your current run, maybe "3 days" if your last miss was recent | Shows 26 dark squares and 4 light ones |
| The story it tells | "You broke it a few times" | "You were consistent almost the entire month" |
| What a miss does | Resets to zero | Adds one lighter square |
| What you feel | Failure, urge to give up | A gap, easy to shrug off |
Same month. Same person. Two completely different emotional readings. The grid is just being honest: 26 out of 30 is a great month, and it looks like one.
Because the grid keeps your full history, momentum is cumulative instead of fragile. Three solid months stay visibly solid even if last Tuesday is blank. You can see, at a glance, that the gap is the exception, not the trend. That is the feeling that gets people to log the next day instead of quietly deleting the app.
It also surfaces patterns a streak never could. A column that is always lighter on weekends. A stretch that went pale during a busy work month and recovered after. The grid is a record you can actually learn from, not just a scoreboard.
But don't streaks work for some people?
Yes. For people driven by loss aversion, the fear of breaking the chain is a real and effective motivator. If watching a number climb keeps you honest, that is a feature, not a bug, and Loggd does not take it away from you.
This is the honest part: the contribution grid is not "better" in some absolute sense. It is better for the large group of people whom streaks discourage. If you have ever quit a habit app the day after breaking a streak, you are in that group, and a forgiving view of progress will keep you in the game longer.
So Loggd does both.
Does Loggd have streaks too?
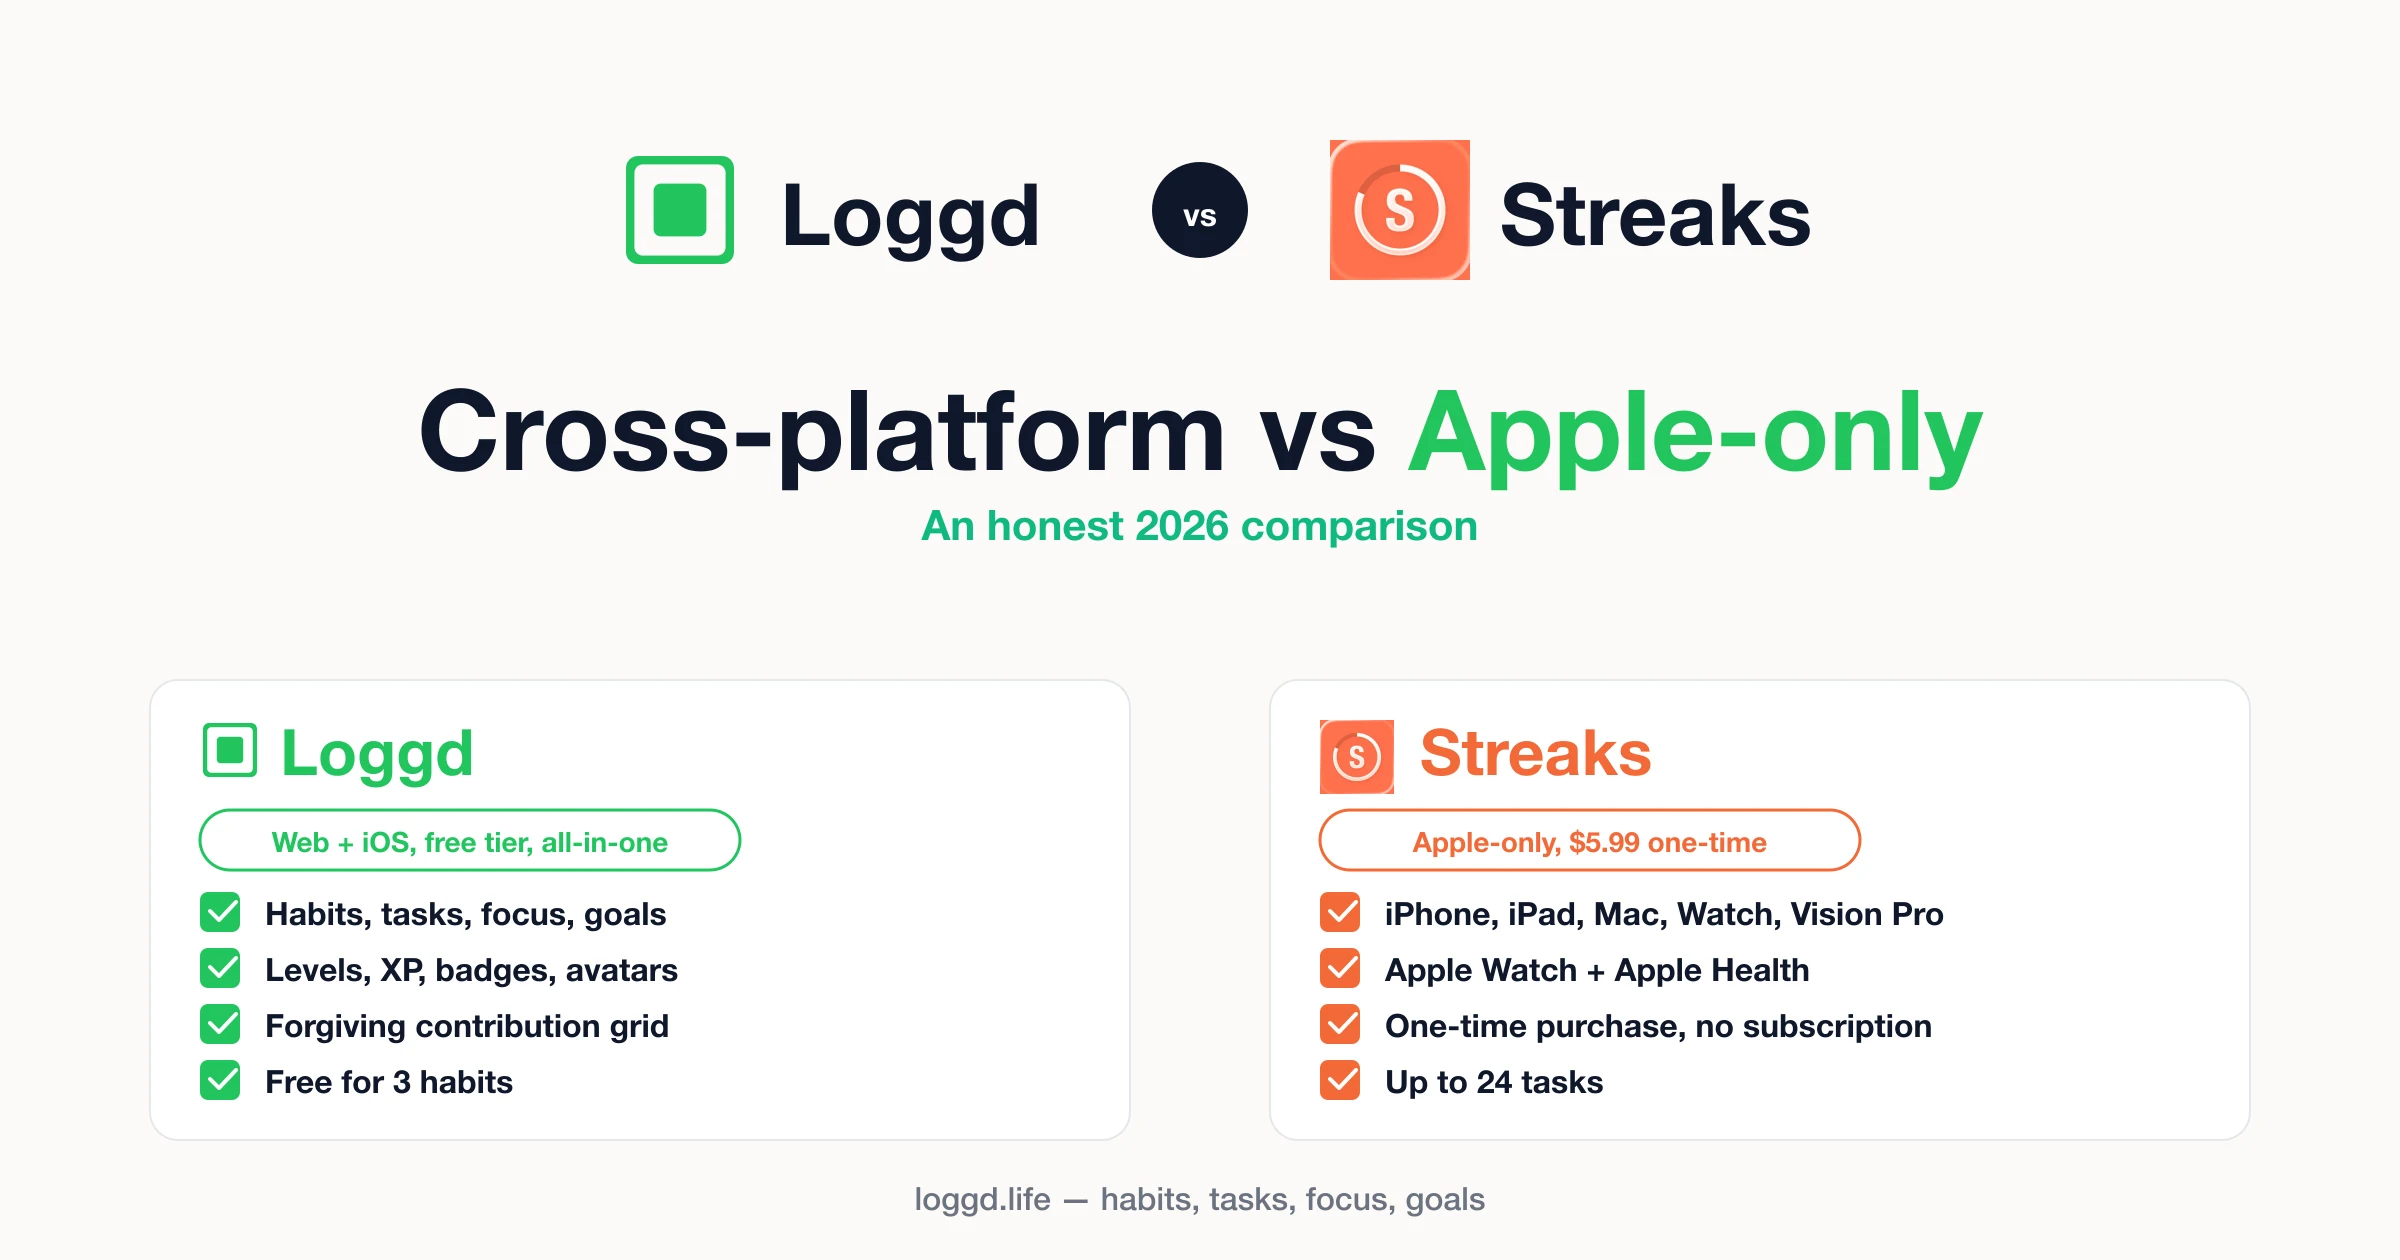
It does. Every habit shows its current streak right next to the grid. If your last miss was recent, the streak number will be small or reset, the same as any streak counter, because that is simply what a streak is.
The difference is hierarchy. The grid is the main view, the thing you see first and the thing that tells the real story. The streak is one signal sitting alongside it, there for people who want it, but not the verdict on whether you are doing well.
You get the motivation of a streak without it being the only number that matters. On a bad day, you can look past the reset streak to a year of green and keep going.
How to read your own grid
A few things to look for once you have a month or two of history:
- Density beats perfection. A grid that is mostly green with a few gaps is a winning grid. Do not chase a flawless wall of dark squares; chase a dense one.
- Watch the trend, not the last square. One light day means nothing. A run of light days means something, and the grid makes that distinction obvious.
- Use the gaps as information. If your misses cluster on certain days, that is a scheduling problem to solve, not a character flaw to feel bad about.
- Recover fast. The whole point of a forgiving system is that the cost of bouncing back is one square. Miss a day, log the next, move on.
The goal is not an unbroken chain. The goal is a year that, looked at from a distance, is unmistakably green.
Frequently asked questions
What is a habit contribution grid?
A calendar-style heatmap of your habit history, modeled on GitHub's green contribution graph. Each day is a square that gets darker the more you log. Loggd shows a rolling 365 days, so one glance covers your whole year. Instead of a single number that resets when you slip, you see the full picture: dense stretches, light patches, and the overall trend.
Why are streaks bad for habits?
They have one structural flaw: a single missed day resets the count to zero, which triggers all-or-nothing thinking (the abstinence-violation effect). Someone who logged 28 of 30 days did great, but a streak tells them they failed and many quit rather than start over. A grid avoids this because a miss is just one lighter square in a year of darker ones.
Does Loggd have streaks?
Yes. Loggd shows a current-streak count on every habit. The difference is that the streak is not the main view, the contribution grid is. You get the motivation of a streak without it being the only thing that defines whether you are doing well.
What happens when I miss a day?
On the grid, a missed day is just a lighter or empty square. Nothing resets and the months behind it stay as dark as you earned them. Your streak counter will reset (that is what a streak does), but the grid keeps the full history, so one off day barely registers against a year of activity.
How is the contribution grid different from GitHub's?
Same visual idea, a year of squares that darken with activity. The difference is what fills them: GitHub plots commits, Loggd plots whatever you track. Loggd also adapts intensity to the habit type, so a yes/no habit, a multiple-times-a-day habit, and a time-based habit each shade their squares differently.
Can I still see a streak if I want one?
Yes. Every habit displays its current streak, so if a running count keeps you going, it is right there. The grid and the streak coexist; the grid just leads because it survives a bad day.
Who is the contribution grid best for?
Anyone who has quit a habit app after breaking a streak. If missing one day makes you want to give up entirely, all-or-nothing tracking is working against you. People with ADHD especially tend to find streak resets discouraging. If loss aversion genuinely drives you, streaks are fine, but the grid is for the larger group streaks quietly push out the door.
About the author
I'm Eusebiu, the solo founder building Loggd. I've been a dev contractor for about five years and I'm now going full time on Loggd, mostly building it in public and sharing the journey with a growing audience on Threads. I track my own habits on the contribution grid every day, usually after my daughter's asleep, which is exactly why I built it to forgive a missed day instead of punishing it. Loggd is available on web and iOS, with Android in development.
Last updated: May 2026.
See your year, not your streak
Start tracking a habit and watch the grid fill in. The first green square is the only hard part, and a missed day later will never undo it.
Try Loggd free. No streak to protect, just a year to fill.