TL;DR. I measured the "never miss twice" rule against 2,066 real habits from 1,006 people. Once a habit has one missed day behind it, 80.9% of those gaps still end with a check. At two missed days it is 71.1%, a drop of about 10 percentage points, and that is the largest single-day drop anywhere in the curve. So the rule is aimed at something real. But there is no cliff at two. By seven missed days the figure is 42.2%, by fourteen it is 26.7%, and every day in between costs another 5 to 8 points. The honest version of the rule is not "two is fatal". It is that the return trip gets more expensive every single day, which makes the cheapest day to come back always today.
The rule is four words long. Never miss twice. One missed day is an accident, two in a row is the start of a different pattern, so whatever else happens, do not lose the second day.
It is James Clear's line from Atomic Habits, and it travels well because it is short and because it gives you something to do the morning after a bad day, which is more than most habit advice manages. What I had never seen was anyone check it against a large pile of real check-ins. I build Loggd, so I have one.
The question I put to the data
Not "how long do streaks last", but a narrower one, more useful if you are the person staring at yesterday's empty square:
Given that a habit has already gone k days without a check, how often does it ever get checked again?
To answer it I took every stretch of consecutive missed days across 2,066 manual habits belonging to 1,006 people, and asked how each stretch ended. Either the person came back and checked, or the stretch was still open on the snapshot date. The percentage below is, of every stretch that reached k missed days, the share that eventually ended with a check.
| Days missed so far | Eventually checked that habit again |
|---|---|
| 1 | 80.9% |
| 2 | 71.1% |
| 3 | 63.3% |
| 4 | 58.3% |
| 5 | 52.5% |
| 6 | 47.3% |
| 7 | 42.2% |
| 10 | 34.3% |
| 14 | 26.7% |
The ends of that curve are not thin. The one-day row rests on 10,808 separate gaps, 8,742 of which ended with a return. The seven-day row is 3,144 gaps and 1,326 returns. The fourteen-day row is 2,312 gaps and 618 returns.
The finding is the slope, not any single number
Read the table as differences rather than levels and the shape gets clearer.
From one missed day to two, the return rate falls by about 10 percentage points. That is the largest single-day drop anywhere in the curve. Every subsequent day costs roughly 5 to 8 points.
So the second day is genuinely the worst single day to lose. If you were going to hang a rule on one day, that is the right day.
But look at what happens after it. Nothing dramatic. Day three costs you, day four costs you, day six costs you. The line keeps sliding at a fairly steady rate all the way out to two weeks. There is no floor where the habit is officially dead and no ledge to fall off. The curve describes a slope with no bottom in sight.
What this supports, and what it does not
Supported: the second day is the sharpest single decision point, so a rule that puts all its weight there is putting it somewhere defensible. If you remember one thing about missed days, "do not lose the day after" is the right thing to keep.
Not supported: the cliff. The way "never miss twice" gets repeated implies that one miss is fine and two is catastrophic, which turns the rule into another version of the all-or-nothing thinking it was supposed to replace. If you already missed twice, the rule as commonly stated has nothing left to say to you. You failed its only test on day two, out of a possible fourteen where the numbers say returning is still ordinary. Look at that fourteen-day row again: 26.7%, which is 618 real returns from a two-week hole.
So the version I would actually give someone is this: the return trip gets harder every single day, so the cheapest day to come back is always today. It says the same thing about day two that Clear's version says. It also still works on day ten, which his does not.
What "coming back" should look like
The mistake I see most often, and have made myself, is treating the return as a debt.
You missed Tuesday, so Wednesday has to be a double session: two runs, forty pages instead of twenty, the workout you skipped plus the one you owe. It feels like accountability. What it does is price the return higher than the original habit, on a day you already proved you had no spare capacity, which is why so many of those Wednesdays quietly become Thursdays.
The data has no opinion about the size of the check, only whether one happened. A two-minute version and a full session are the same row in the table.
So make the return the smallest honest version of the thing. The run becomes a walk to the end of the road. Twenty pages becomes one page. The gym session becomes the bag by the door and ten minutes of something. Then mark it and let the day be completely ordinary: no ceremony, no restart post, no recommitment. The point of the small version is that it costs almost nothing, and the whole finding here is about cost.
If you want the fuller treatment of what to change so the miss happens less often in the first place, that is how to stop quitting habits. This post is only about the days after.
Why the record you keep changes the odds
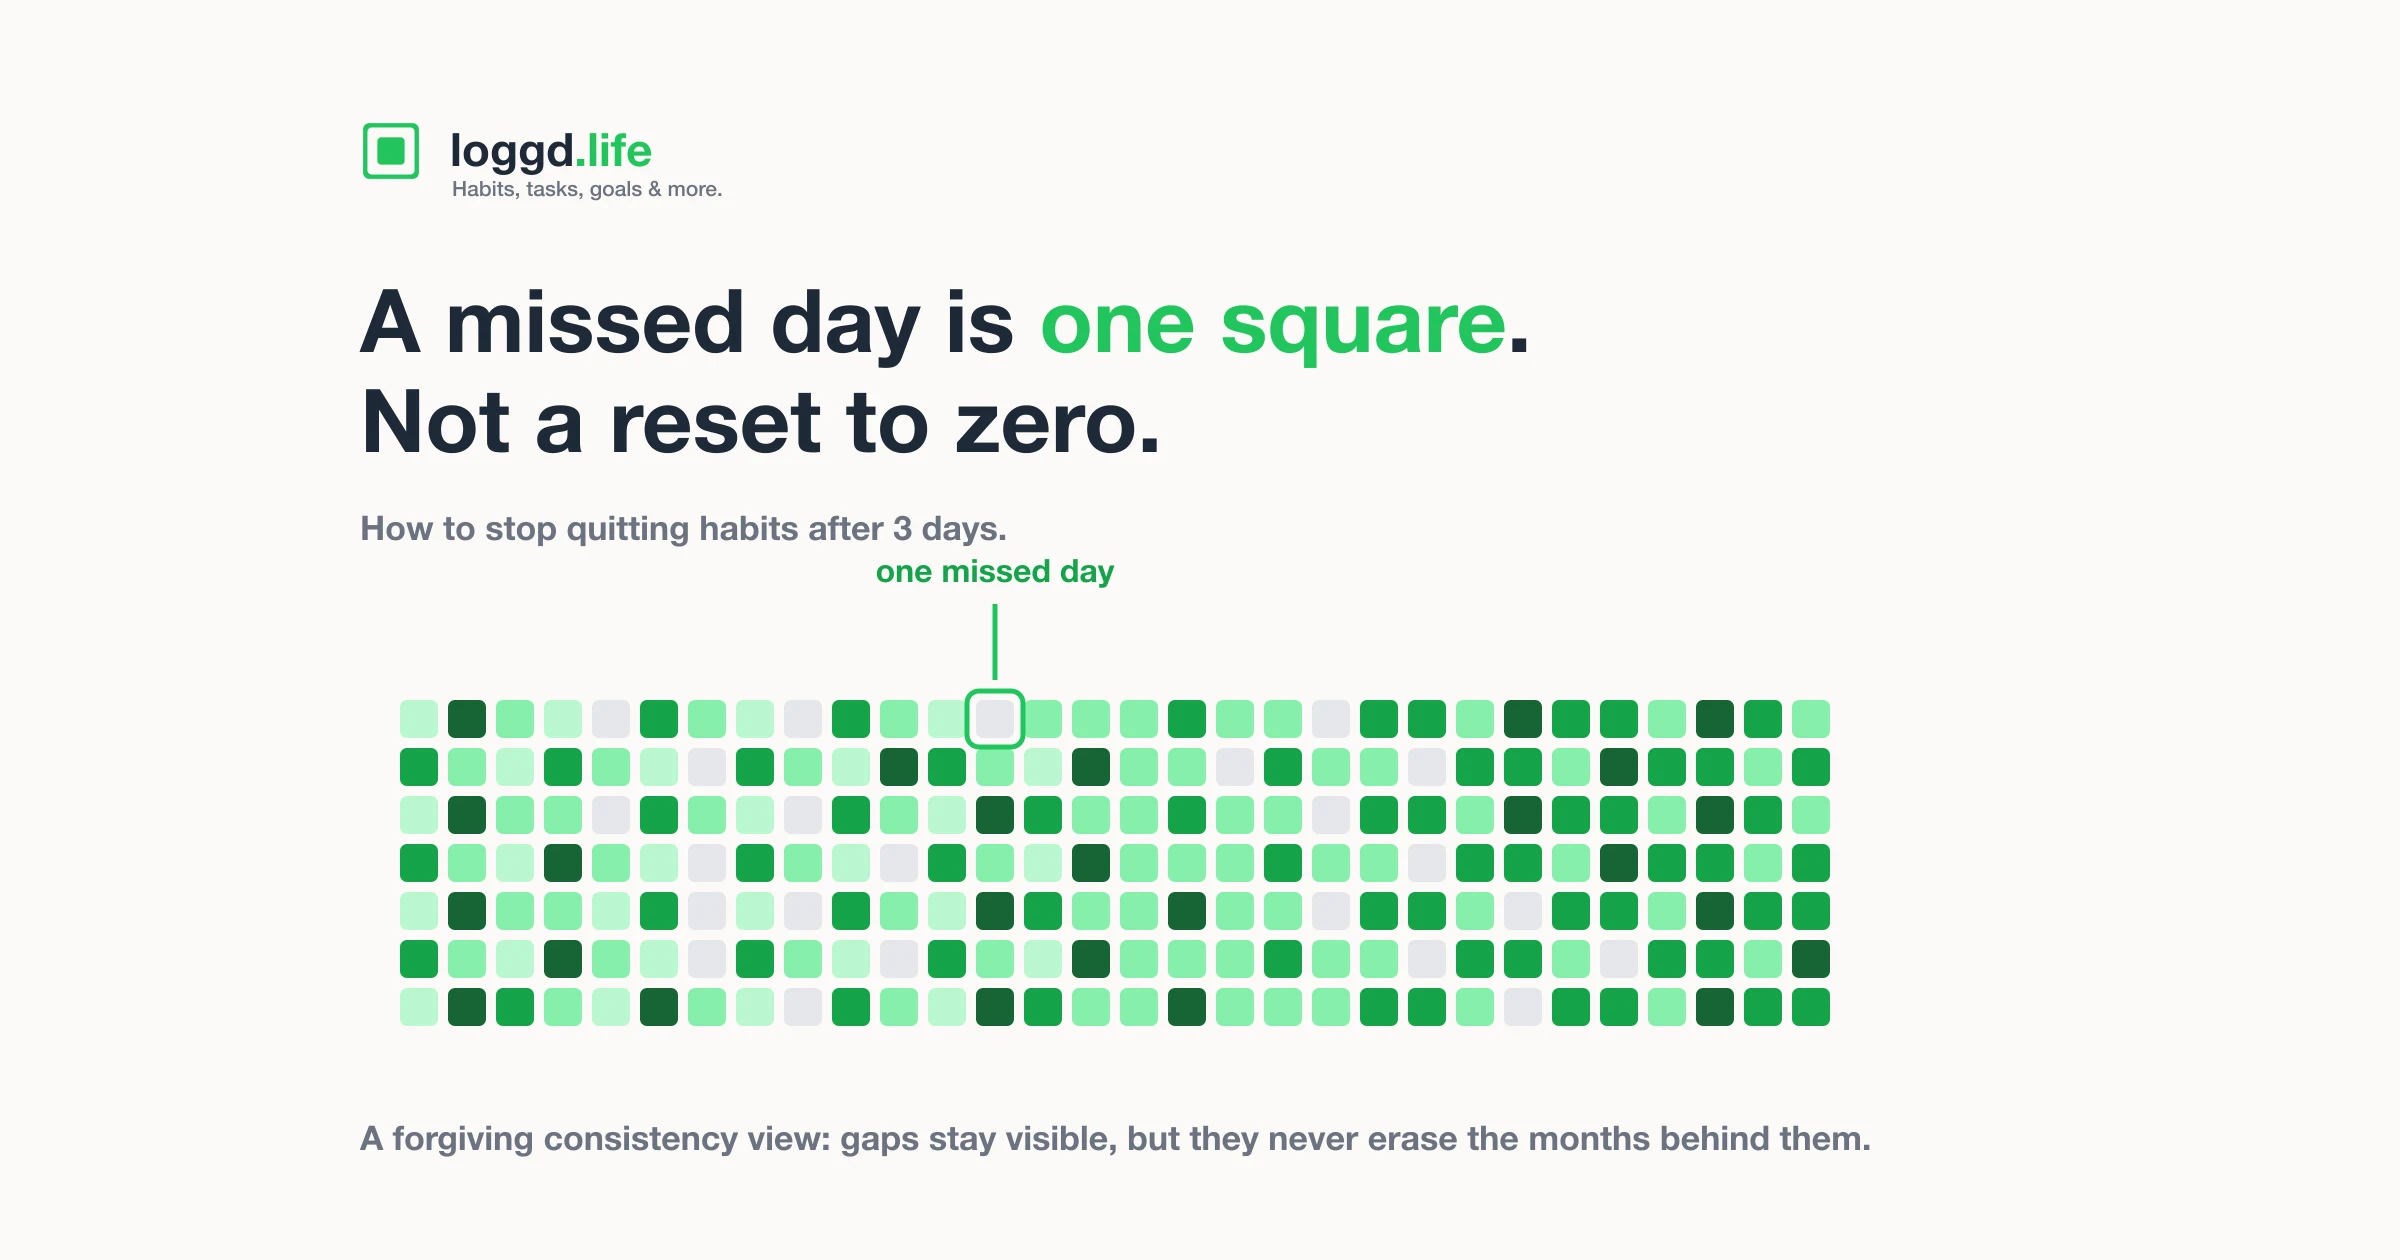
There is a second reason the make-up session is tempting, and it is usually sitting on your screen. A streak counter that shows a month of work and then shows zero has told you the month was worth nothing. That is not a neutral display, it is an argument, and the argument it makes the morning after a miss is that the run is already ruined. Which is the exact story that turns one missed day into two.
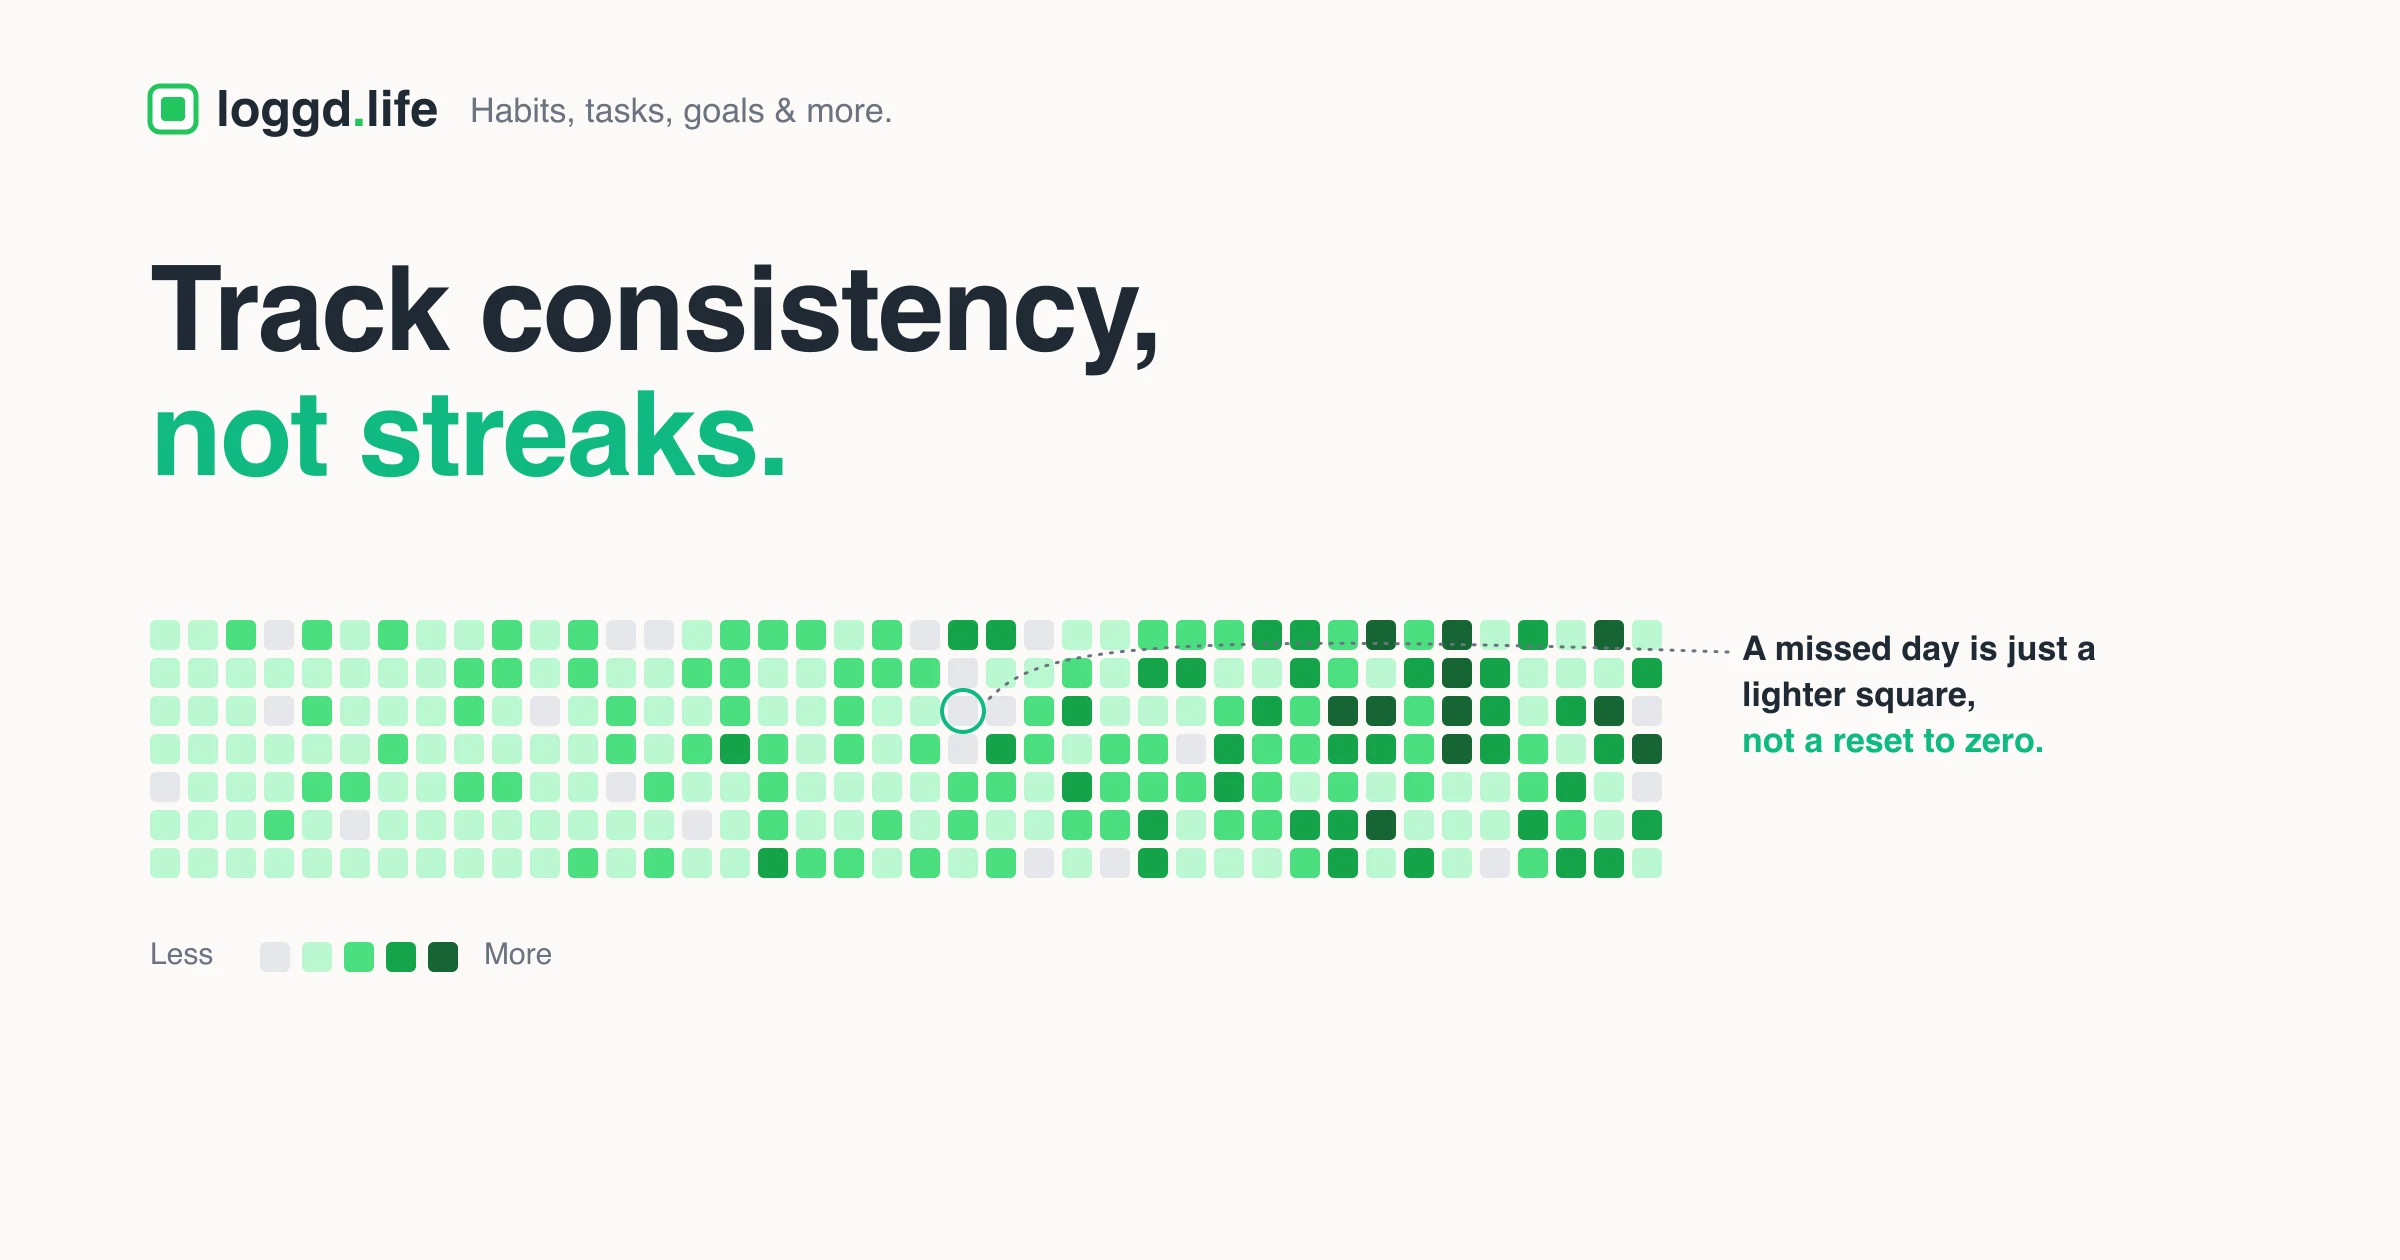
A grid makes a different argument. One lighter square in a wall of darker ones is a proportionate account of what happened: you missed a day in a month of days. I have written the full case for that design in contribution grid versus streaks, and the curve above is the strongest evidence for it I have found. If day two is where most people are lost, the display you look at on day one should not be the thing arguing for giving up.
Two of our free tools sit on either side of that line. The habit streak calculator is deliberately streak-shaped: you click the days you did the thing on a calendar and it shows your current run, your longest ever run, and a consistency percentage (days completed divided by days since your start date), all in your browser. The consistency figure is the interesting one, because it keeps counting when the streak resets to zero. The 100 day tracker takes the opposite approach: days made and current run are separate numbers, so a skipped day restarts nothing.
Decide your miss policy before you need it
The version of you that misses a Thursday in November is tired, slightly embarrassed, and unusually receptive to the idea that the whole thing is already over. That is not the person who should be setting policy. So write it down now, while nothing is at stake. Mine is three lines:
- A missed day is a missed day. It gets marked honestly and nothing else happens.
- The next day is the normal version of the habit, not a bigger one.
- If I miss twice, the third day is the smallest version I can think of, and I still do not restart the count.
Rule three is the one the data added. The common phrasing of "never miss twice" leaves you with no move once you have already missed twice, and the numbers say that is precisely when a move is still worth making.
What this data is not
Four things to know before citing any of the above.
This is correlation, not an experiment. Nobody was assigned a missed day. Habits that were already fragile or badly sized are over-represented among the long gaps, so part of what the falling curve measures is which habits were shaky to begin with, not what the missing did to them.
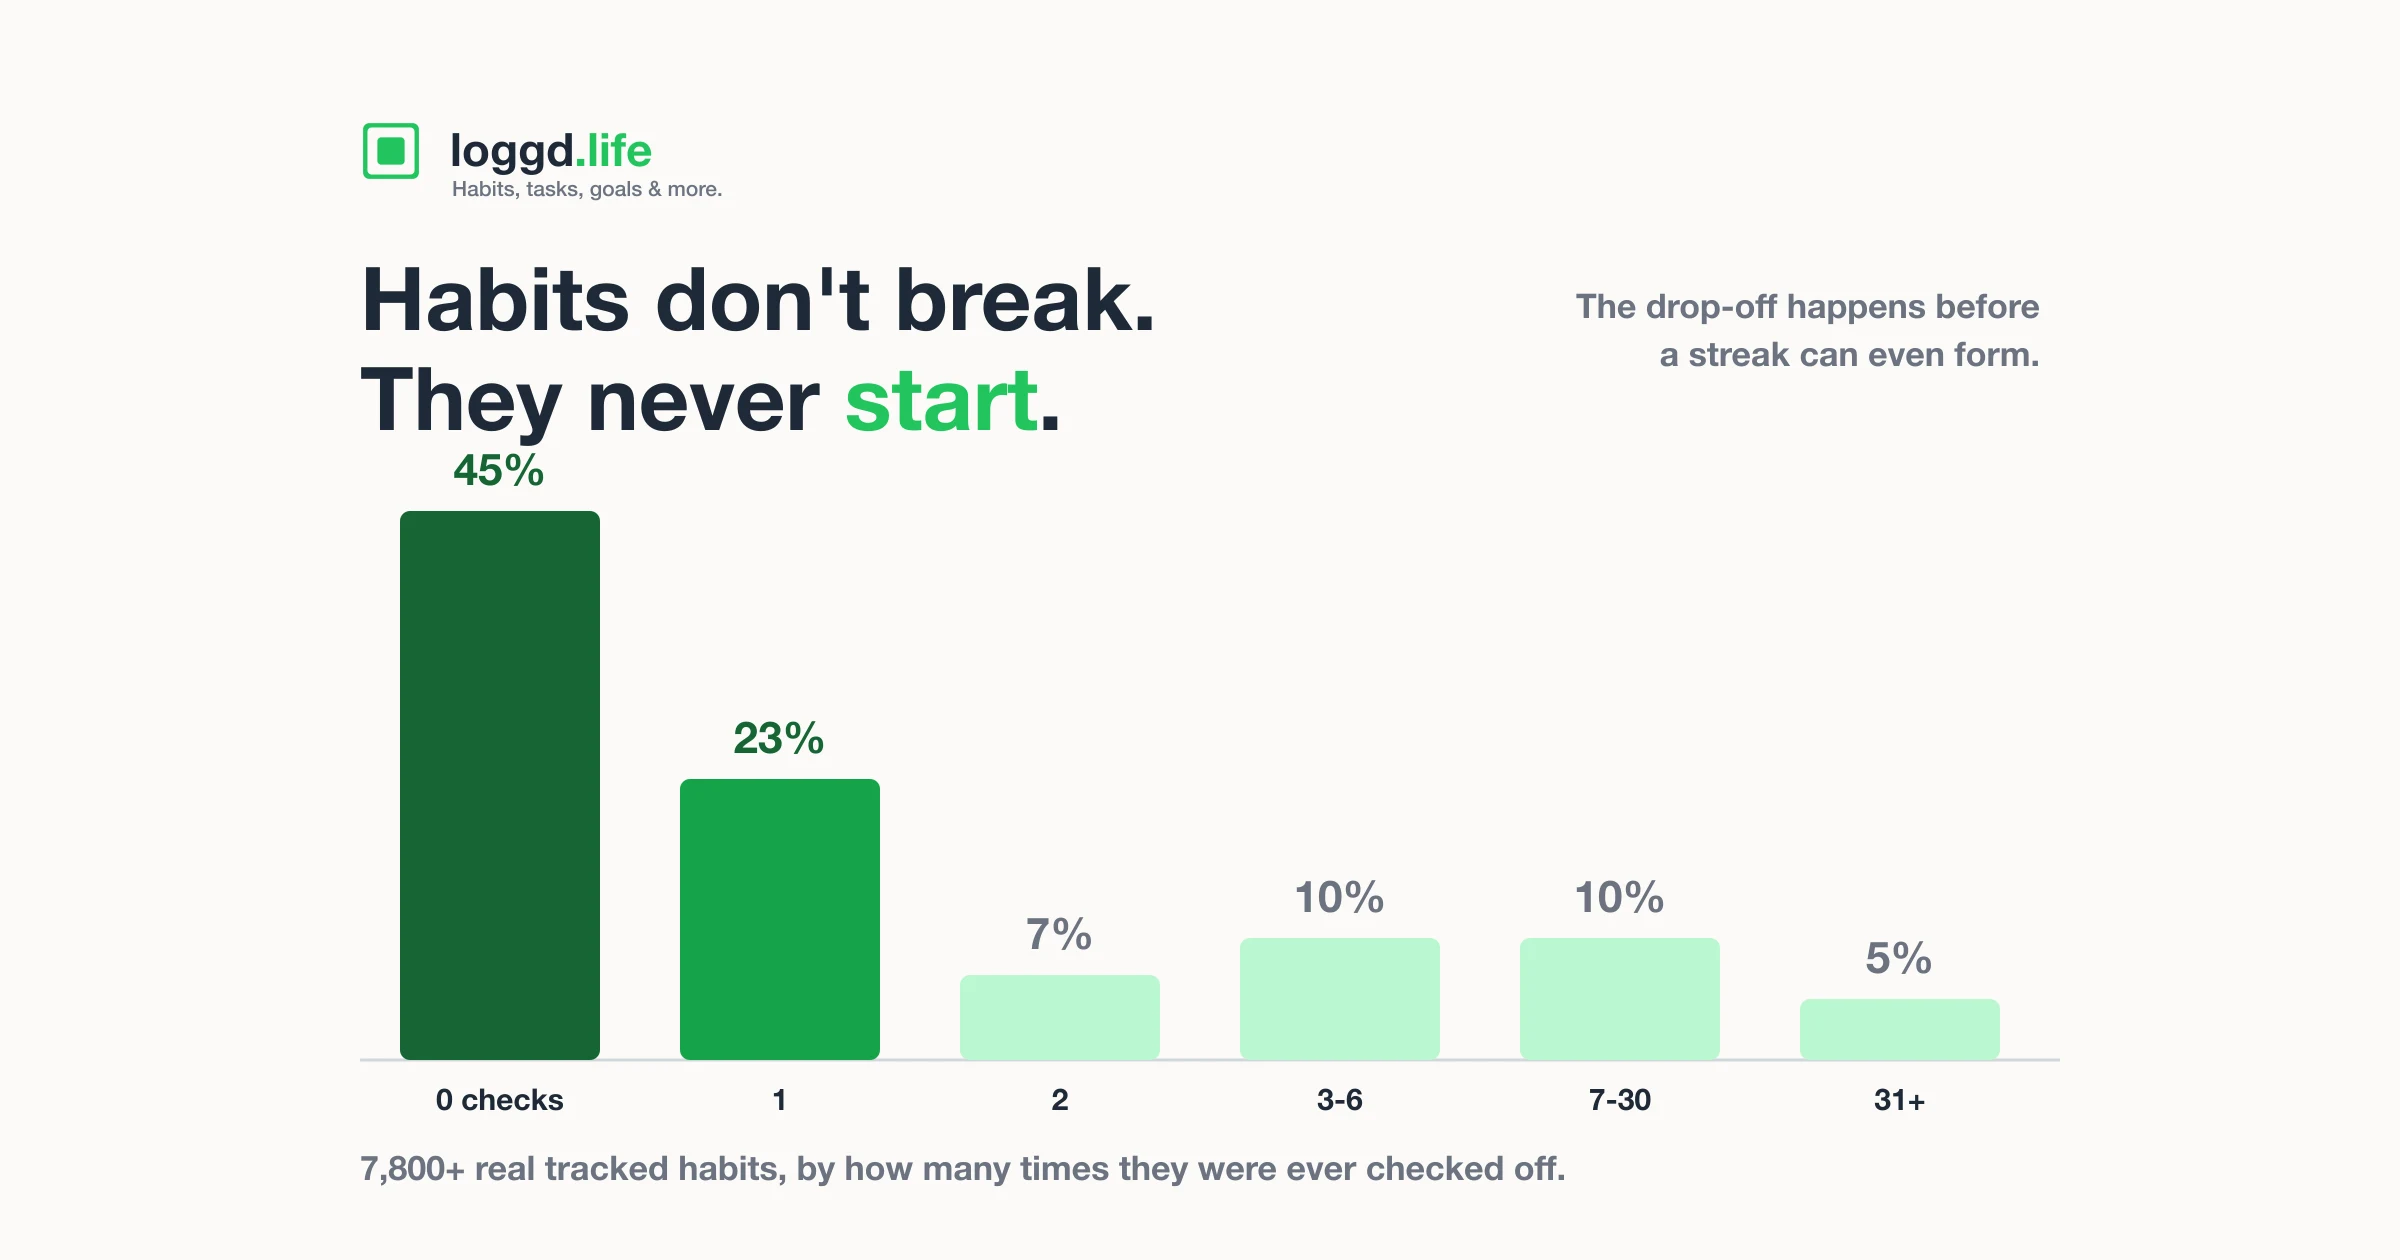
Survivorship. Only habits checked on at least two separate days are in this sample. Habits that were created and never really started are excluded entirely, and that is a much larger group than this one. It is covered in habits people quit fastest, which is where to go for the real abandonment picture.
Censoring. A stretch still open on the snapshot date counts as "not yet returned". That is the correct survival treatment, but it means gaps that started shortly before the snapshot are judged early.
Day attribution is UTC. A late-night check can land on the neighbouring day for some users, which blurs individual gap lengths at the edges.
Methodology
Figures come from a production snapshot dated 2026-08-05, covering 2,066 manual habits with at least two distinct check days, across 1,006 distinct users, with the demo account excluded. Integration-fed habits (GitHub, Threads) were excluded entirely, because they auto-check and would erase every gap they contain. Every stretch of consecutive missed days was counted; a stretch either ended because the person checked in again, or was still open on the snapshot date. Each percentage is the share of stretches reaching that length that eventually ended with a check. No individual user data, no free text, and no habit-level detail is published. The broader dataset these habits sit inside is described in what 4,000 habit trackers reveal.
The one sentence version
Never miss twice is good advice pointed at the right day and wrapped in the wrong story. There is no cliff, only a slope that charges you a few points of your own return odds every day you stay away. Which means the question in front of you is never "is this ruined". It is only ever "is today cheaper than tomorrow". It is. It always is.
Last updated: December 2026.
Written by Eusebiu, the solo founder building Loggd in public. I build the app in the evenings around contract work and a small daughter, so the missed days in my own grid are not hypothetical, which is why I keep pointing queries at them. I post the numbers as I find them on Threads.
Track habits without the all-or-nothing pressure. Loggd shows your consistency as a forgiving contribution grid instead of a streak that resets to zero, so a missed Tuesday stays one lighter square and coming back on Wednesday costs you nothing. Start free.