TL;DR. A long life is roughly 4,000 weeks. Written as a number it slides straight off. Drawn as a grid of 4,000 small squares with the lived ones already filled in, it does not. The point of the exercise is not to cram more output into the squares that are left. Oliver Burkeman's argument in Four Thousand Weeks is nearly the opposite: finitude is the fact, and most productivity advice is a way of refusing to accept it. Worth saying plainly too: for some people this material tips into anxiety rather than clarity, and that is a real response, not a weakness. If you take one action, take one that fits inside this week.
The arithmetic
Fifty-two weeks a year.
Eighty years is 4,160 weeks. Ninety years, which almost nobody gets, is 4,680. The life in weeks visualizer starts from a life expectancy of 78.5 years, which comes out at roughly 4,080, and lets you swap in a country estimate or drag the slider anywhere from 60 to 100.
However you set it, the answer lands in the same neighbourhood. A long life is about four thousand weeks.
There is no trick in that calculation. It is one multiplication that anybody could do on the back of a receipt, which makes it slightly strange that so few people ever have. I certainly had not, and I build software about time for a living.
If you are 35, roughly 1,820 of those squares are already coloured in. If you are 45, it is about 2,340, which is over half.
Read that as a sentence and it is fine. It is a fact, it is unsurprising, you move on with your day.
Why the grid hits differently
Here is the part I find genuinely interesting as someone who builds tracking interfaces: the number and the picture carry identical information and produce completely different reactions.
"You have about 2,000 weeks left" is a statistic. Statistics are processed as arguments. You can nod at an argument and forget it by lunchtime.
Two thousand small empty squares sitting under two thousand filled ones is a shape. Shapes are processed as objects. You do not evaluate them, you just see them, and the seeing arrives before you can arrange a defence.
This is exactly the effect I lean on inside Loggd, in a much smaller register. A streak counter tells you a number. A year of consistency drawn as a grid of squares tells you a shape, and the shape is honest about the gaps in a way a counter never is. I wrote about that trade-off in contribution grid versus streaks. Same mechanism, different scale: a grid removes the option of rounding your own history into a story you prefer.
The life grid just applies it to the largest possible unit.
What the tool actually shows you
You enter a birth date, set an expectancy, and it draws the rows.
Lived weeks are filled, the most recent ones brighter. The current week pulses. Amber squares mark the standard milestones the tool ships with: born, starting school, adulthood at 18, career at 22, then the decade markers and retirement at 65. Everything past your estimate goes transparent.
Two panels underneath do more damage than the grid, in my experience.
The first is an activity breakdown built from population averages: around 26 years asleep, 13 working, 11 on screens, 4 eating and cooking, 2 commuting, 2 on chores. Those are broad averages rather than anything about you specifically, and the tool says so. The line that tends to land is the last row, which shows truly free time and, once the others are subtracted, sits at roughly zero. Slightly cheap as rhetoric. Also difficult to argue with.
The second is a "weeks left for" panel that converts weeks into countable things. Summers remaining. Christmases remaining. Sundays with ageing parents, on the stated assumption of about twelve visits a year. Books, at roughly one every two weeks. The assumptions are visible so you can disagree with them, and the disagreeing is part of the exercise.
The parents number is the one that gets people. It got me. If you see your parents around a dozen times a year and they are in their seventies, the figure that comes back is not a large number, and no amount of arguing with the assumptions moves it far.
Everything stays in your browser. There is no account and nothing is uploaded, which for this particular exercise seems like the minimum decency.
The Burkeman correction
The internet mostly uses the 4,000-week framing as fuel. Time is short, therefore wake up earlier, therefore optimise, therefore run the arc, therefore build the second income stream.
Burkeman's book argues something considerably less comfortable. His claim is that the shortness of life is not a problem to be solved by better systems, because there is no arrangement of your calendar in which you get to do everything that matters to you. Efficiency does not close that gap. It usually widens it, because clearing the queue faster mostly produces more queue.
The move he suggests is not intensity. It is choosing on purpose and then accepting the cost of the choice, instead of running faster in the hope of one day not having to choose at all.
I find this hard to hold onto, for a reason that is not flattering: I sell a habit tracker. My whole instinct is that the grid should make you do more. But the honest reading of the exercise is that it should mostly make you drop things, and only then make a small number of remaining things non-negotiable.
If you want to work out which things, the two exercises that pair naturally are the core values quiz, which forces trade-offs between values rather than letting you claim all of them, and the bucket list maker, which is only useful if you are ruthless about the difference between what you actually want and what sounds impressive in a list.
The honest counter-position
Memento mori content has a failure mode, and most articles about life in weeks skip it.
For a meaningful number of people, sustained attention on mortality does not produce clarity. It produces rumination. If you live with health anxiety, intrusive thoughts about death, or the kind of anxious loop that is easy to start and very hard to stop, a wall of squares counting down is not a neutral piece of design. It is an anxiety machine with a nice colour palette.
The standard defence is that mortality awareness is associated with more values-aligned choices. That is a real research literature and the tool cites it. It is also a population-level claim, and population-level claims say nothing about whether an individual evening spent staring at the grid did you any good.
So: if filling this in leaves you deciding, use it. If it leaves you spiralling, close the tab and do not treat that as a failure. Knowing which tools suit you is a skill, not a concession. And this is a perspective exercise rather than treatment, so if the spiral is a pattern rather than an evening, that is a conversation for an actual professional, not a grid.
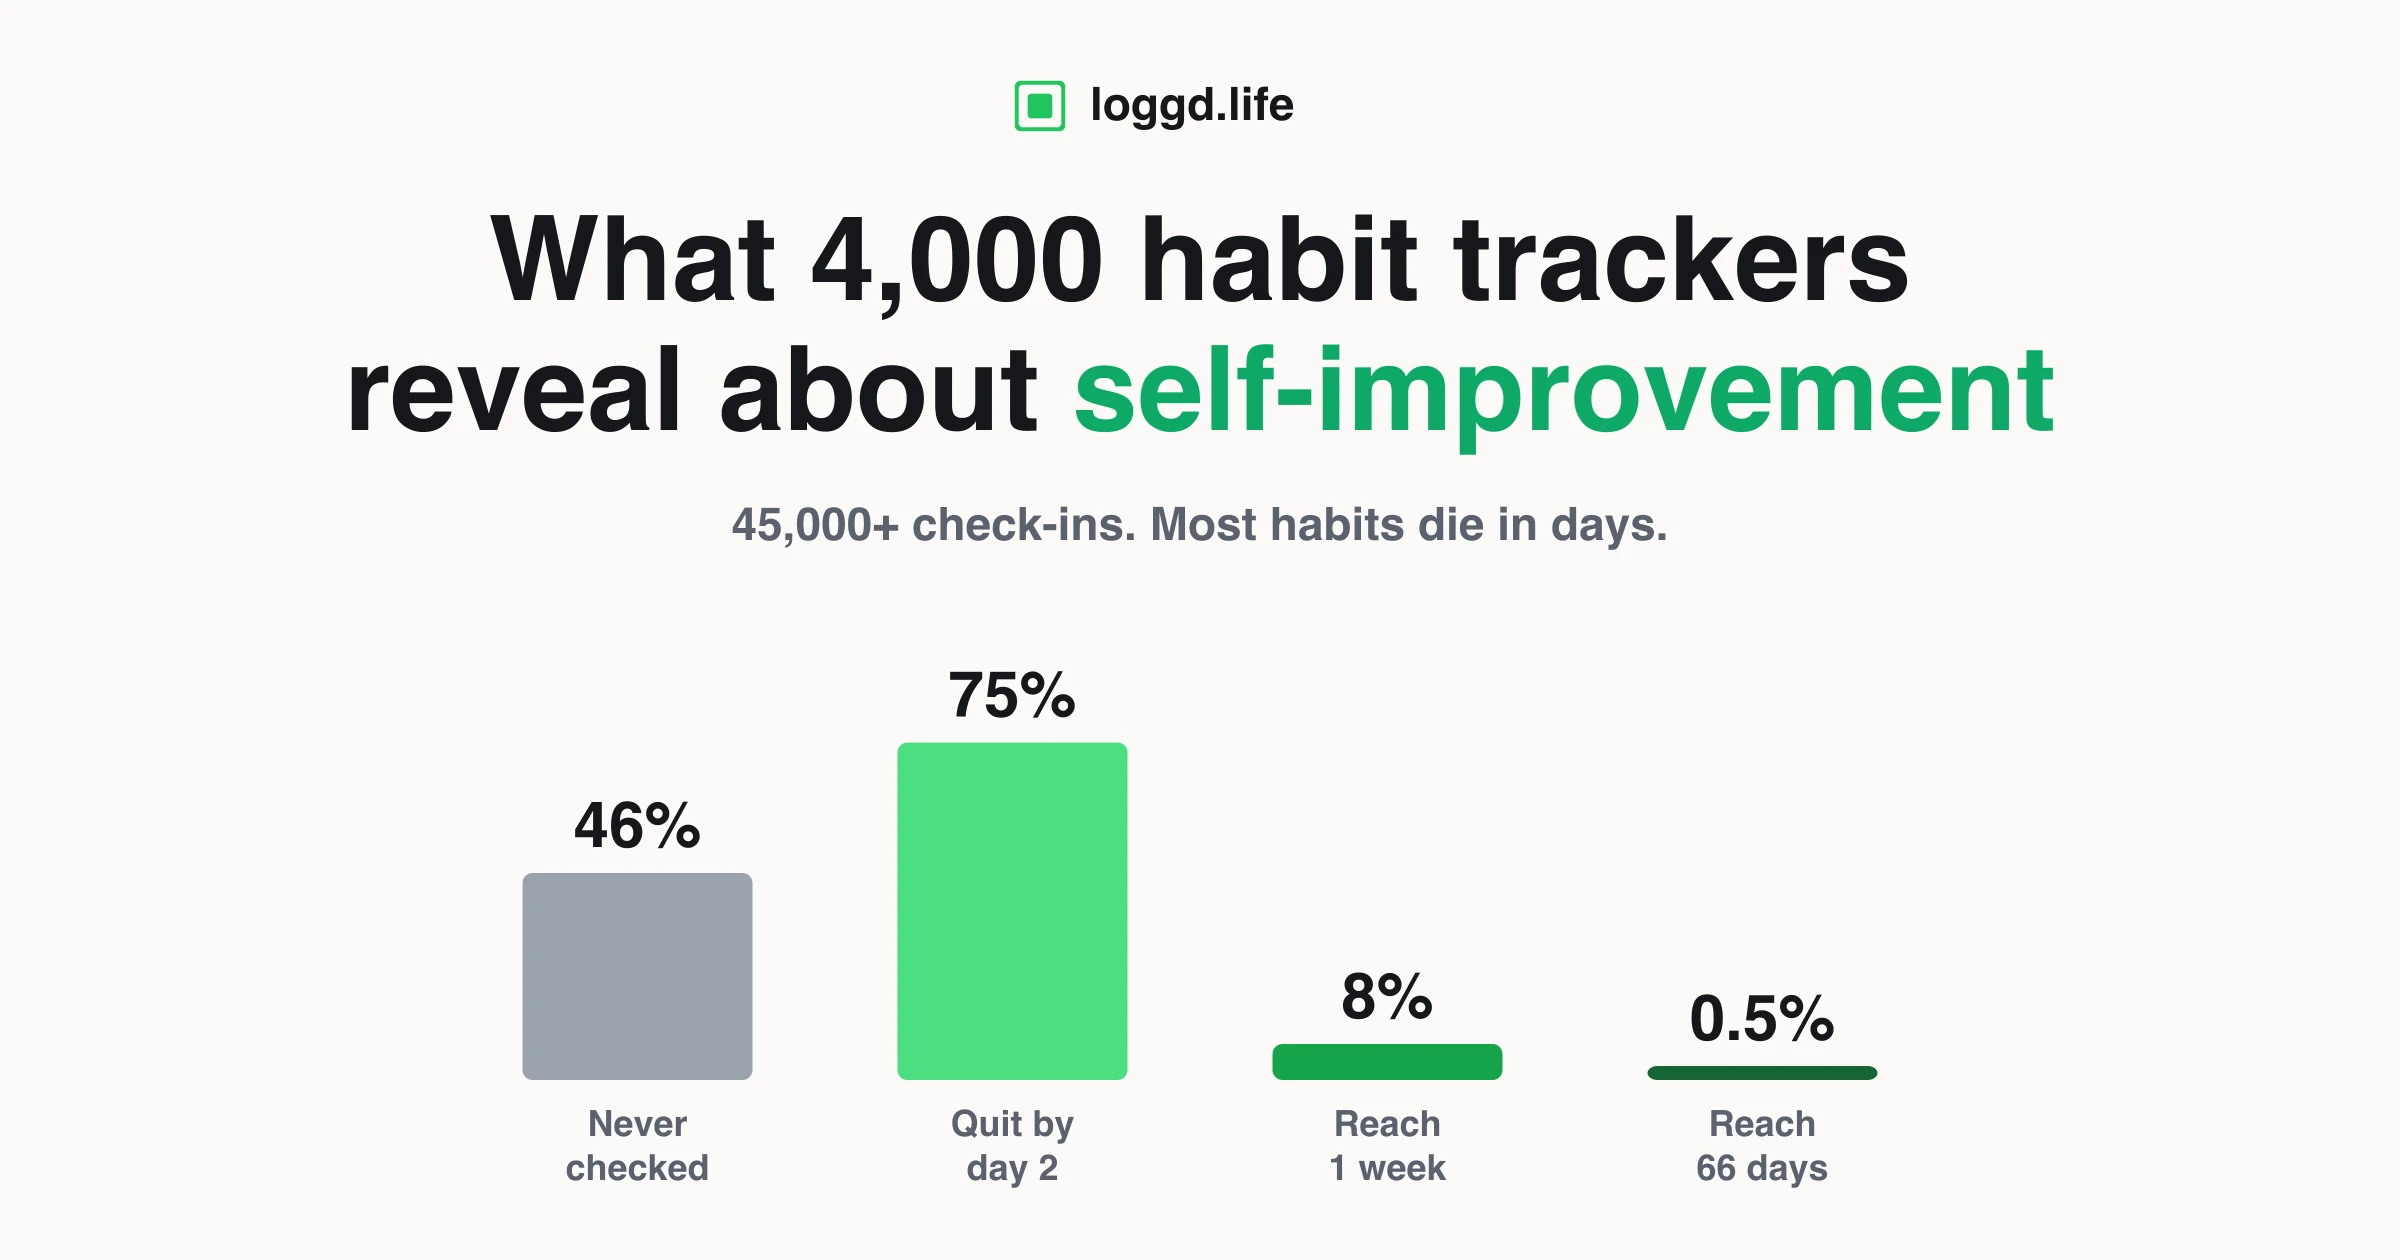
There is a milder version of the same problem too. A grid can produce a hit of urgency that feels like progress and is not. Sunday night, big feelings, fifteen resolutions. By Thursday, nothing. That pattern is extremely well documented in tracking data: across the habits people set up in Loggd, around 45% were never checked off even once, and another 23% were checked exactly once and then abandoned, which is covered in habits people quit fastest. Ambition at setup time is cheap. The grid makes it cheaper.
One thing worth doing with this week
Here is the whole practical output, and I would rather it be small and survive than large and impressive.
Look at the current square. That one, the one that is pulsing. It is this week, and unlike the fifty thousand words of planning the exercise tends to produce, it is the only square you have any control over right now.
Then answer one question: what is the one thing I would most regret not doing in the next seven days?
Not this year. Not before I die. Seven days.
It is almost never the impressive answer. Usually it is a phone call to someone whose weeks are running out faster than yours. Sometimes it is an evening that belongs to your kid rather than your laptop. Occasionally it is a booking you have been about to make for two years.
Put it in the calendar with a time attached and close the tab.
If the grid surfaced bigger items, and it probably did, write them somewhere they will survive the week rather than acting on all of them tonight. Then come back when you are calm rather than while the number is still ringing. The exercise is not urgent. It will produce the same result in April.
That is the honest version of this. Not a productivity system. One multiplication, one picture, and one decision small enough that you will actually keep it.
Last updated: September 2026.
Written by Eusebiu, the solo founder building Loggd in public. I build it in the evenings around contract work and a small daughter, which is its own weekly reminder that the squares are not theoretical. I share what the aggregate data keeps showing on Threads.
Keep the weeks you actually used. Loggd records consistency as a forgiving contribution grid, so a quiet week reads as a quiet week instead of a reset to zero. Start free.